This is a followup to yesterday’s post on the visualization of a day’s worth of trading data on the NASDAQ stock exchange. We’ve taken another look at the same dataset a bit more closely. In the examples that follow, each of which represents a single minute of trading, the image on the left uses a unique color to represent each trader, and the image on the right uses a unique color to represent each stock. So on the left hand (trader) side, a big grouping of the same color means that a single trader is buying or selling stocks. And on the right hand (stock) side, a big color block means a single stock being purchased in lots of different transactions.
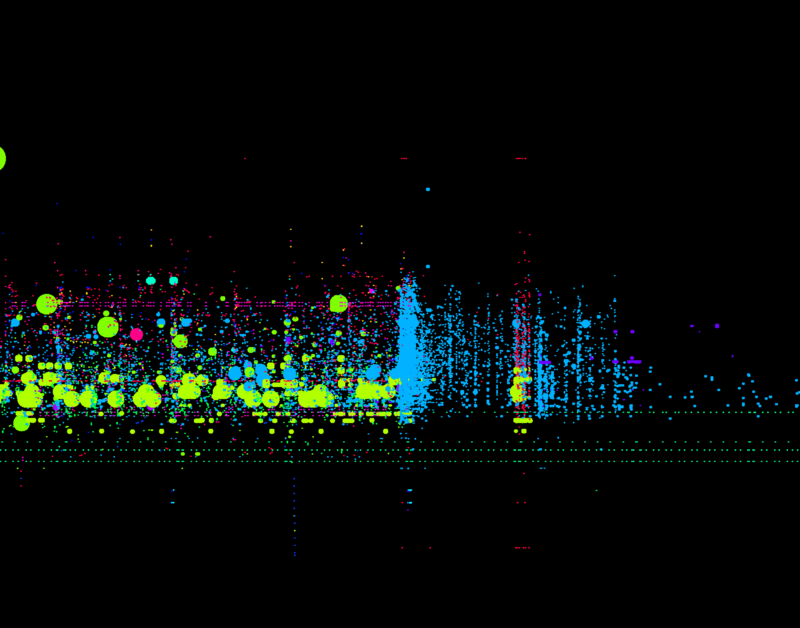
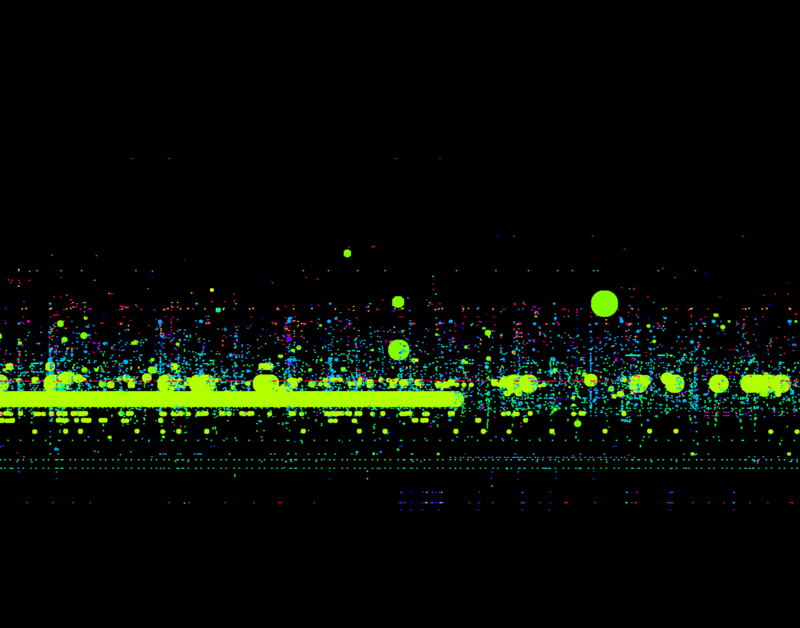
In this first example, we see that a single trader (UBS, in this case) is responsible for the majority of the shares in this minute:
and that they’re regularly trading a single stock at a single price at the same amounts (the yellow dots in a row):
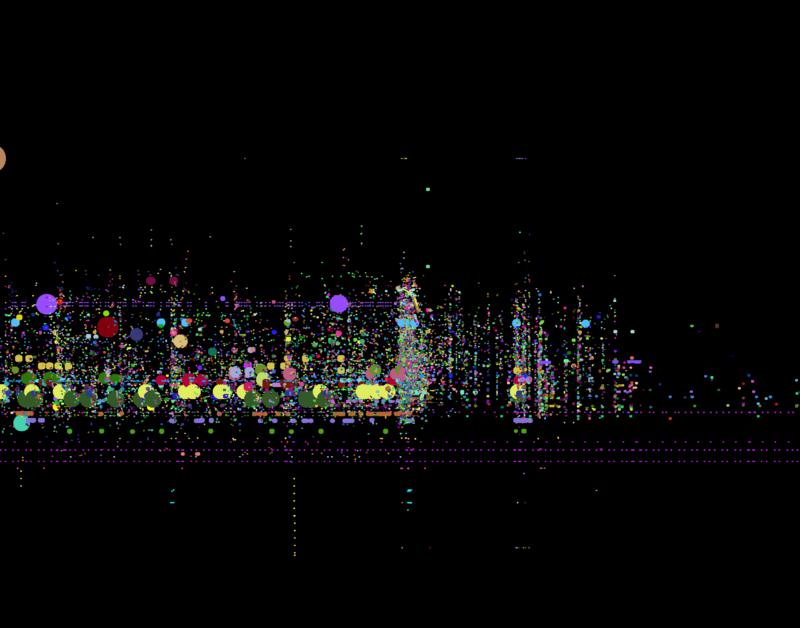
Here we see that UBS buys a fixed amount of a stock at a fixed price, very steadily, stops abruptly, and then starts trading a different stock at a slightly lower price (the dark green and then blue dots on the right):
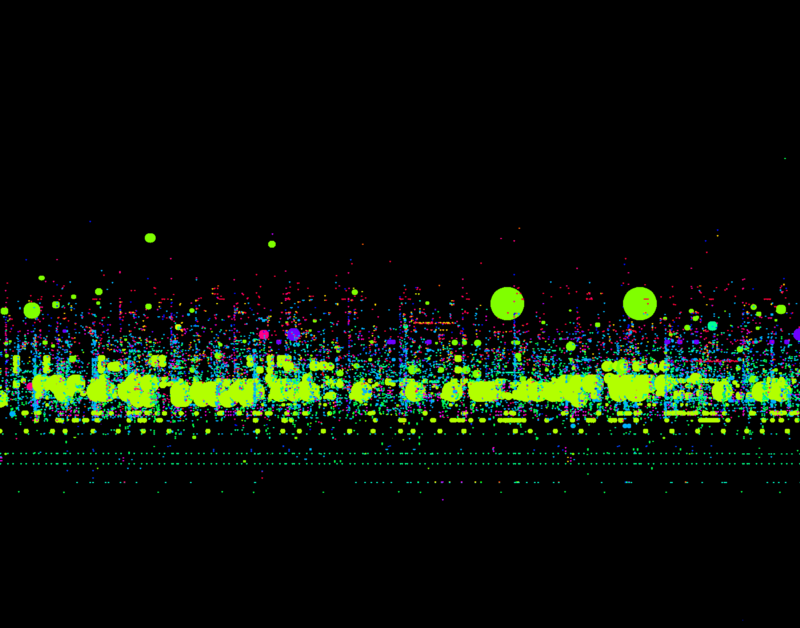
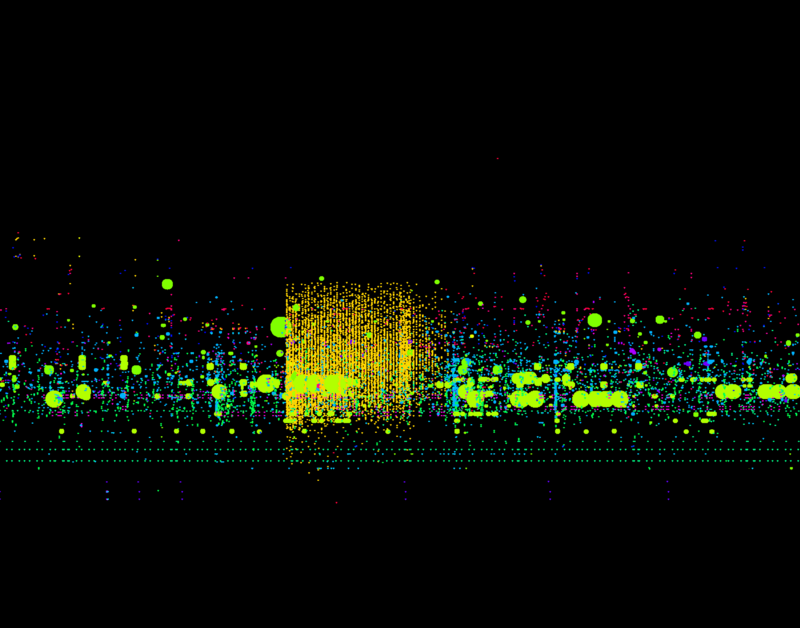
Here we see a single trader (the orangish square at left) perform a burst of concentrated activity within precisely deliniated margins, making small trades across a wide range of stocks (the kaleidosopic square on the right)

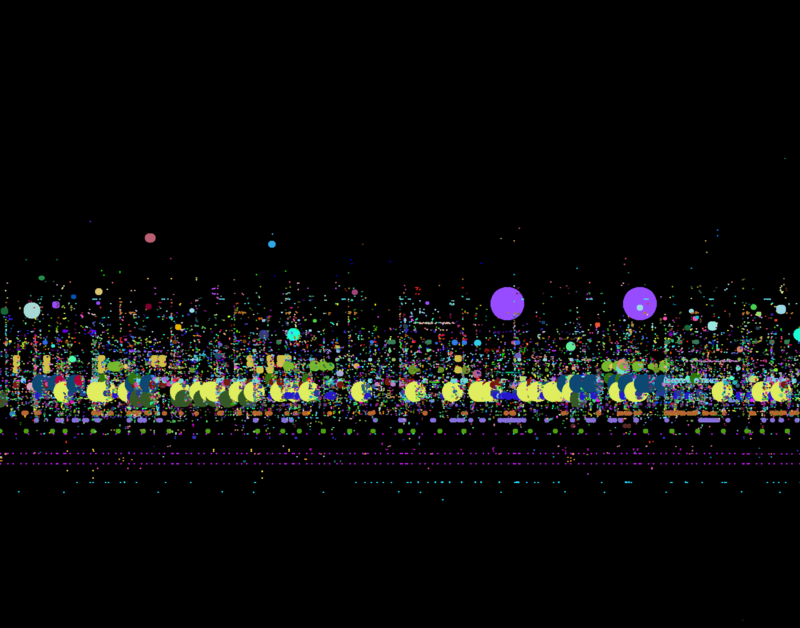
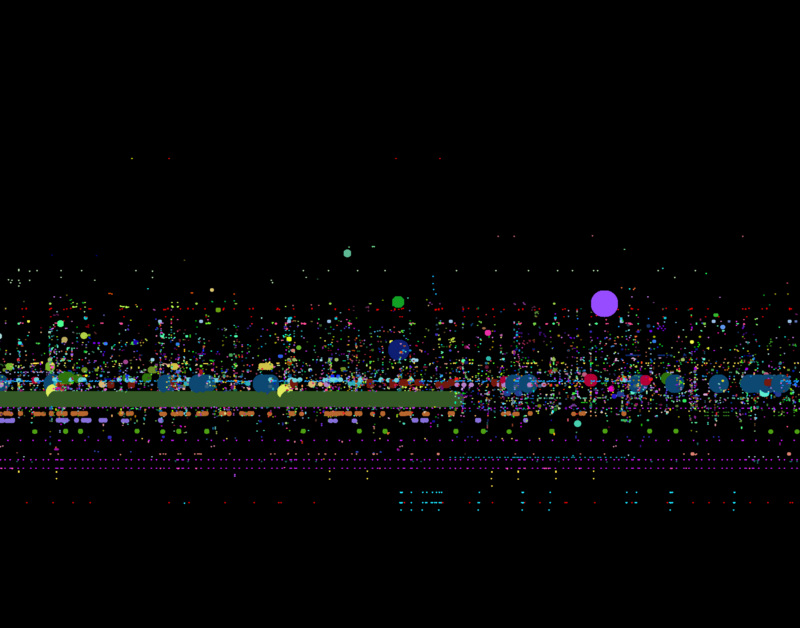
And here we see a similarly trader-centric burst (in blue, at left) spread across a multiplicity of small stock trades, just before the market closes for the day.